Writing in Typst
Let’s get started! Suppose you got assigned to write a technical report for university. It will contain prose, maths, headings, and figures. To get started, you create a new project on the Typst app. You’ll be taken to the editor where you see two panels: A source panel where you compose your document and a preview panel where you see the rendered document.
You already have a good angle for your report in mind. So let’s start by writing the introduction. Enter some text in the editor panel. You’ll notice that the text immediately appears on the previewed page.
In this report, we will explore the
various factors that influence fluid
dynamics in glaciers and how they
contribute to the formation and
behaviour of these natural structures.
Throughout this tutorial, we’ll show code examples like this one. Just like in the app, the first panel contains markup and the second panel shows a preview. We shrunk the page to fit the examples so you can see what’s going on.
The next step is to add a heading and emphasize some text. Typst uses simple markup for the most common formatting tasks. To add a heading, enter the = character and to emphasize some text with italics, enclose it in _underscores_.
= Introduction
In this report, we will explore the
various factors that influence _fluid
dynamics_ in glaciers and how they
contribute to the formation and
behaviour of these natural structures.
That was easy! To add a new paragraph, just add a blank line in between two lines of text. If that paragraph needs a subheading, produce it by typing == instead of =. The number of = characters determines the nesting level of the heading.
Now we want to list a few of the circumstances that influence glacier dynamics. To do that, we use a numbered list. For each item of the list, we type a + character at the beginning of the line. Typst will automatically number the items.
+ The climate
+ The topography
+ The geology
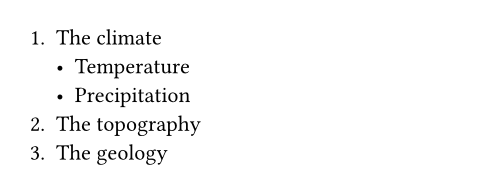
If we wanted to add a bulleted list, we would use the - character instead of the + character. We can also nest lists: For example, we can add a sub-list to the first item of the list above by indenting it.
+ The climate
- Temperature
- Precipitation
+ The topography
+ The geology
Adding a figure
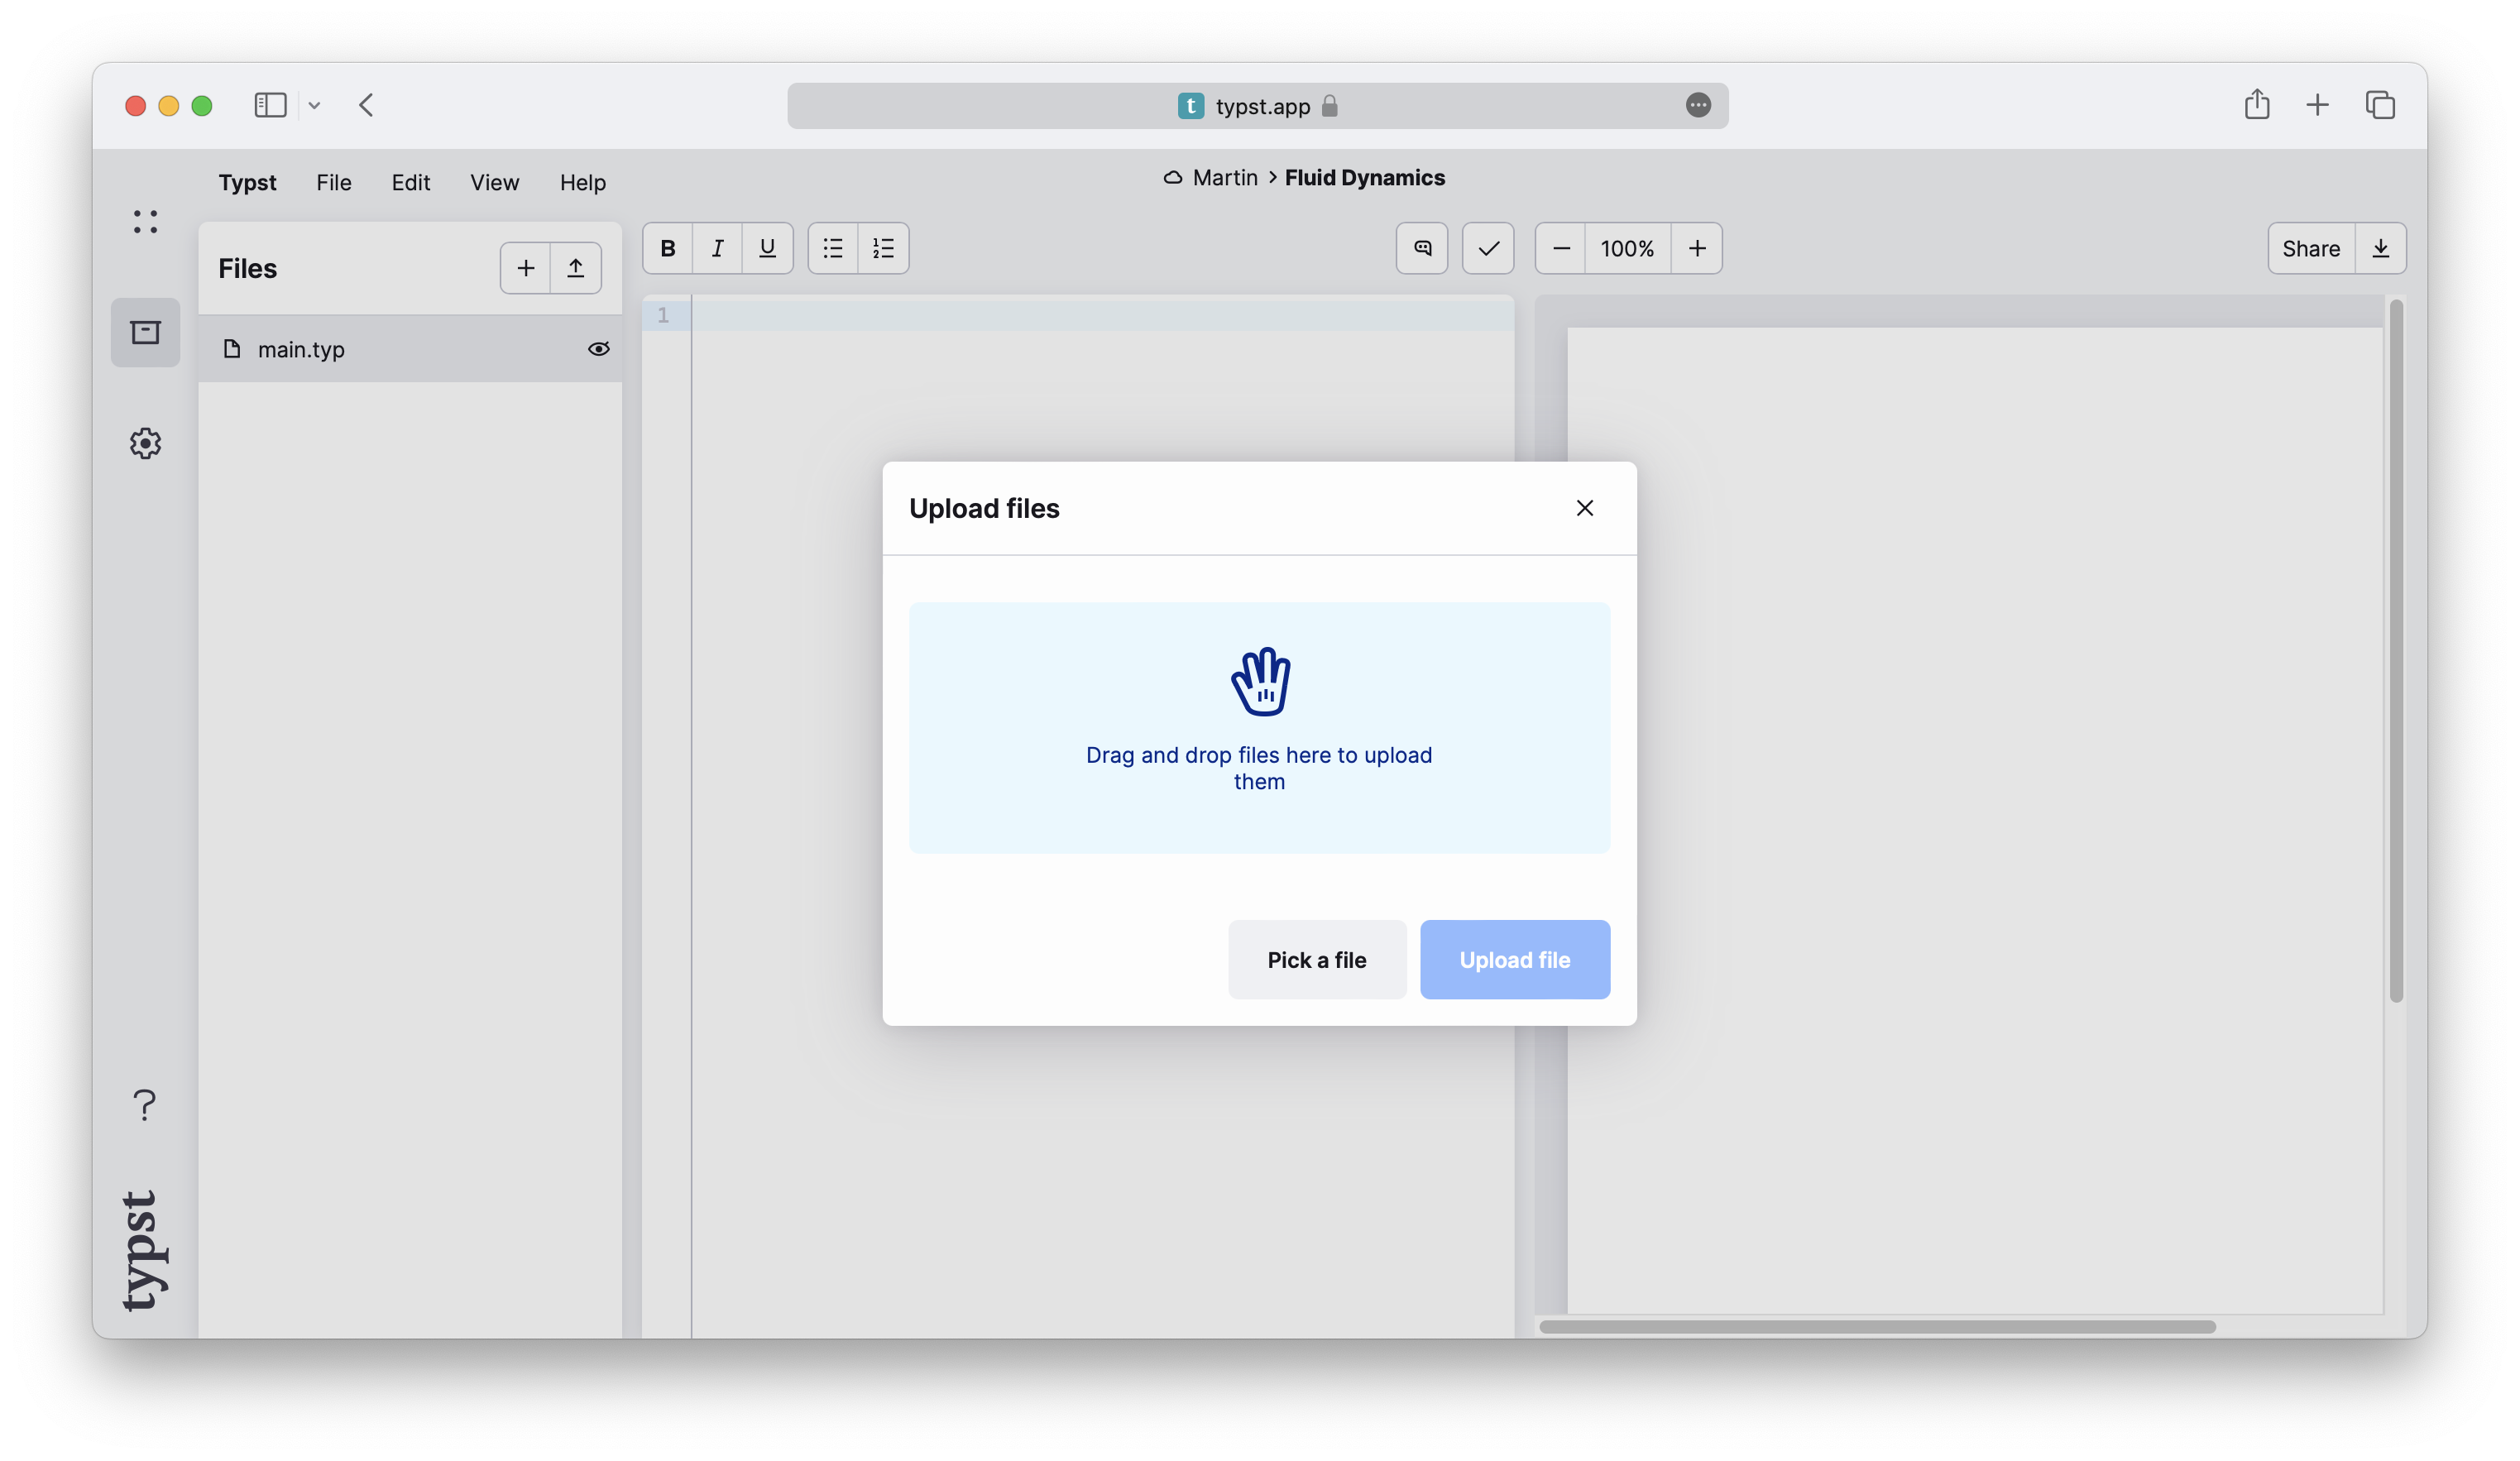
You think that your report would benefit from a figure. Let’s add one. Typst supports images in the formats PNG, JPEG, GIF, SVG, PDF, and WebP. To add an image file to your project, first open the file panel by clicking the box icon in the left sidebar. Here, you can see a list of all files in your project. Currently, there is only one: The main Typst file you are writing in. To upload another file, click the button with the arrow in the top-right corner. This opens the upload dialog, in which you can pick files to upload from your computer. Select an image file for your report.
We have seen before that specific symbols (called markup) have specific meaning in Typst. We can use =, -, +, and _ to create headings, lists and emphasized text, respectively. However, having a special symbol for everything we want to insert into our document would soon become cryptic and unwieldy. For this reason, Typst reserves markup symbols only for the most common things. Everything else is inserted with functions. For our image to show up on the page, we use Typst’s image function.
#image("glacier.jpg")
In general, a function produces some output for a set of arguments. When you call a function within markup, you provide the arguments and Typst inserts the result (the function’s return value) into the document. In our case, the image function takes one argument: The path to the image file. To call a function in markup, we first need to type the # character, immediately followed by the name of the function. Then, we enclose the arguments in parentheses. Typst recognizes many different data types within argument lists. Our file path is a short string of text, so we need to enclose it in double quotes.
The inserted image uses the whole width of the page. To change that, pass the width argument to the image function. This is a named argument and therefore specified as a name: value pair. If there are multiple arguments, they are separated by commas, so we first need to put a comma behind the path.
#image("glacier.jpg", width: 70%)
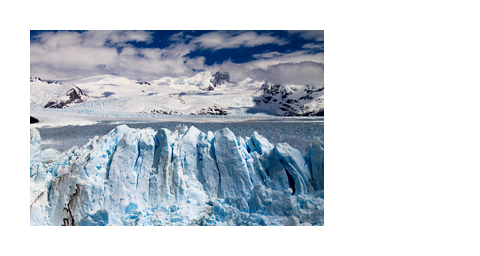
The width argument is a relative length. In our case, we specified a percentage, determining that the image shall take up 70% of the page’s width. We also could have specified an absolute value like 1cm or 0.7in.
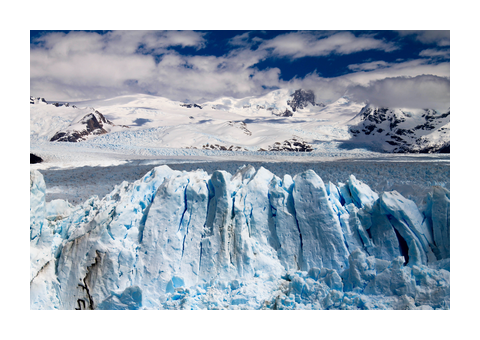
Just like text, the image is now aligned at the left side of the page by default. It’s also lacking a caption. Let’s fix that by using the figure function. This function takes the figure’s contents as a positional argument and an optional caption as a named argument.
Within the argument list of the figure function, Typst is already in code mode. This means, you now have to remove the hash before the image function call. The hash is only needed directly in markup (to disambiguate text from function calls).
The caption consists of arbitrary markup. To give markup to a function, we enclose it in square brackets. This construct is called a content block.
#figure(
image("glacier.jpg", width: 70%),
caption: [
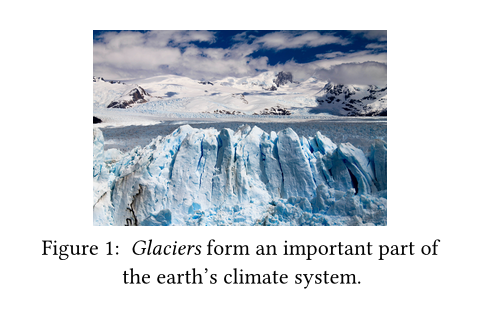
_Glaciers_ form an important part
of the earth's climate system.
],
)
You continue to write your report and now want to reference the figure. To do that, first attach a label to figure. A label uniquely identifies an element in your document. Add one after the figure by enclosing some name in angle brackets. You can then reference the figure in your text by writing an @ symbol followed by that name. Headings and equations can also be labelled to make them referenceable.
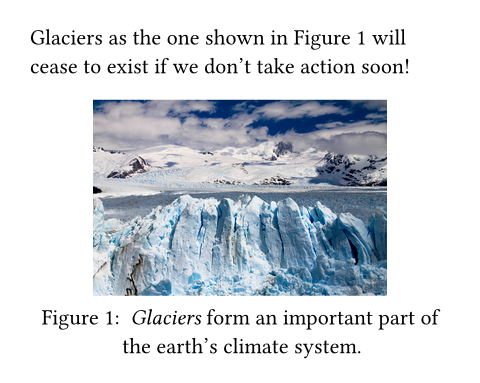
Glaciers as the one shown in
@glaciers will cease to exist if
we don't take action soon!
#figure(
image("glacier.jpg", width: 70%),
caption: [
_Glaciers_ form an important part
of the earth's climate system.
],
) <glaciers>
So far, we’ve passed content blocks (markup in square brackets) and strings (text in double quotes) to our functions. Both seem to contain text. What’s the difference?
A content block can contain text, but also any other kind of markup, function calls, and more, whereas a string is really just a sequence of characters and nothing else.
For example, the image function expects a path to an image file. It would not make sense to pass, e.g., a paragraph of text or another image as the image’s path parameter. That’s why only strings are allowed here. In contrast, strings work wherever content is expected because text is a valid kind of content.
Adding a bibliography
As you write up your report, you need to back up some of your claims. You can add a bibliography to your document with the bibliography function. This function expects a path to a bibliography file.
Typst’s native bibliography format is Hayagriva, but for compatibility you can also use BibLaTeX files. As your classmate has already done a literature survey and sent you a .bib file, you’ll use that one. Upload the file through the file panel to access it in Typst.
Once the document contains a bibliography, you can start citing from it. Citations use the same syntax as references to a label. As soon as you cite a source for the first time, it will appear in the bibliography section of your document. Typst supports different citation and bibliography styles. Consult the reference for more details.
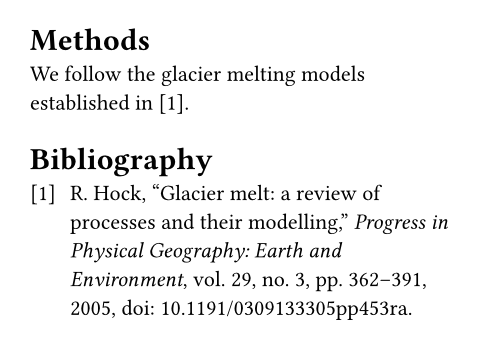
= Methods
We follow the glacier melting models
established in @glacier-melt.
#bibliography("works.bib")
Maths
After fleshing out the methods section, you move on to the meat of the document: Your equations. Typst has built-in mathematical typesetting and uses its own math notation. Let’s start with a simple equation. We wrap it in $ signs to let Typst know it should expect a mathematical expression:
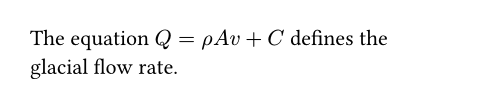
The equation $Q = rho A v + C$
defines the glacial flow rate.
The equation is typeset inline, on the same line as the surrounding text. If you want to have it on its own line instead, you should insert a single space at its start and end:
The flow rate of a glacier is
defined by the following equation:
$ Q = rho A v + C $
We can see that Typst displayed the single letters Q, A, v, and C as-is, while it translated rho into a Greek letter. Math mode will always show single letters verbatim. Multiple letters, however, are interpreted as symbols, variables, or function names. To imply a multiplication between single letters, put spaces between them.
If you want to have a variable that consists of multiple letters, you can enclose it in quotes:
The flow rate of a glacier is given
by the following equation:
$ Q = rho A v + "time offset" $
You’ll also need a sum formula in your paper. We can use the sum symbol and then specify the range of the summation in sub- and superscripts:
Total displaced soil by glacial flow:
$ 7.32 beta +
sum_(i=0)^nabla Q_i / 2 $
To add a subscript to a symbol or variable, type a _ character and then the subscript. Similarly, use the ^ character for a superscript. If your sub- or superscript consists of multiple things, you must enclose them in round parentheses.
The above example also showed us how to insert fractions: Simply put a / character between the numerator and the denominator and Typst will automatically turn it into a fraction. Parentheses are smartly resolved, so you can enter your expression as you would into a calculator and Typst will replace parenthesized sub-expressions with the appropriate notation.
Total displaced soil by glacial flow:
$ 7.32 beta +
sum_(i=0)^nabla
(Q_i (a_i - epsilon)) / 2 $
Not all math constructs have special syntax. Instead, we use functions, just like the image function we have seen before. For example, to insert a column vector, we can use the vec function. Within math mode, function calls don’t need to start with the # character.
$ v := vec(x_1, x_2, x_3) $

Some functions are only available within math mode. For example, the cal function is used to typeset calligraphic letters commonly used for sets. The math section of the reference provides a complete list of all functions that math mode makes available.
One more thing: Many symbols, such as the arrow, have a lot of variants. You can select among these variants by appending a dot and a modifier name to a symbol’s name:
$ a arrow.squiggly b $

This notation is also available in markup mode, but the symbol name must be preceded with #sym. there. See the symbols section for a list of all available symbols.
Review
You have now seen how to write a basic document in Typst. You learned how to emphasize text, write lists, insert images, align content, and typeset mathematical expressions. You also learned about Typst’s functions. There are many more kinds of content that Typst lets you insert into your document, such as tables, shapes, and code blocks. You can peruse the reference to learn more about these and other features.
For the moment, you have completed writing your report. You have already saved a PDF by clicking on the download button in the top right corner. However, you think the report could look a bit less plain. In the next section, we’ll learn how to customize the look of our document.