Table Guide
Tables are a great way to present data to your readers in an easily readable, compact, and organized manner. They are not only used for numerical values, but also survey responses, task planning, schedules, and more. Because of this wide set of possible applications, there is no single best way to lay out a table. Instead, think about the data you want to highlight, your document’s overarching design, and ultimately how your table can best serve your readers.
Typst can help you with your tables by automating styling, importing data from other applications, and more! This guide takes you through a few of the most common questions you may have when adding a table to your document with Typst. Feel free to skip to the section most relevant to you – we designed this guide to be read out of order.
If you want to look up a detail of how tables work, you should also check out their reference page. And if you are looking for a table of contents rather than a normal table, the reference page of the outline function is the right place to learn more.
How to create a basic table?
In order to create a table in Typst, use the table function. For a basic table, you need to tell the table function two things:
- The number of columns
- The content for each of the table cells
So, let’s say you want to create a table with two columns describing the ingredients for a cookie recipe:
#table(
columns: 2,
[*Amount*], [*Ingredient*],
[360g], [Baking flour],
[250g], [Butter (room temp.)],
[150g], [Brown sugar],
[100g], [Cane sugar],
[100g], [70% cocoa chocolate],
[100g], [35-40% cocoa chocolate],
[2], [Eggs],
[Pinch], [Salt],
[Drizzle], [Vanilla extract],
)
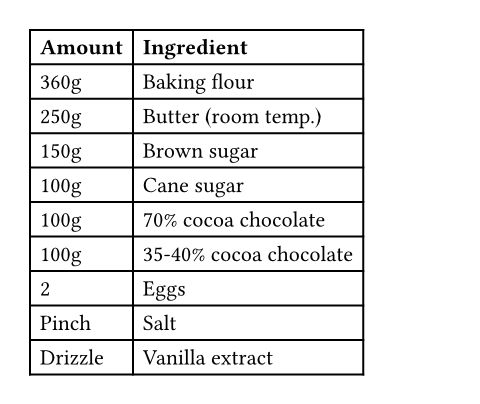
This example shows how to call, configure, and populate a table. Both the column count and cell contents are passed to the table as arguments. The argument list is surrounded by round parentheses. In it, we first pass the column count as a named argument. Then, we pass multiple content blocks as positional arguments. Each content block contains the contents for a single cell.
To make the example more legible, we have placed two content block arguments on each line, mimicking how they would appear in the table. You could also write each cell on its own line. Typst does not care on which line you place the arguments. Instead, Typst will place the content cells from left to right (or right to left, if that is the writing direction of your language) and then from top to bottom. It will automatically add enough rows to your table so that it fits all of your content.
It is best to wrap the header row of your table in the table.header function. This clarifies your intent and will also allow Typst to make the output more accessible to users with a screen reader:
#table(
columns: 2,
table.header[*Amount*][*Ingredient*],
[360g], [Baking flour],
// ... the remaining cells
)
You could also write a show rule that automatically strongly emphasizes the contents of the first cells for all tables. This quickly becomes useful if your document contains multiple tables!
#show table.cell.where(y: 0): strong
#table(
columns: 2,
table.header[Amount][Ingredient],
[360g], [Baking flour],
// ... the remaining cells
)
We are using a show rule with a selector for cell coordinates here instead of applying our styles directly to table.header. This is due to a current limitation of Typst that will be fixed in a future release.
Congratulations, you have created your first table! Now you can proceed to change column sizes, adjust the strokes, add striped rows, and more!
How to change the column sizes?
If you create a table and specify the number of columns, Typst will make each column large enough to fit its largest cell. Often, you want something different, for example, to make a table span the whole width of the page. You can provide a list, specifying how wide you want each column to be, through the columns argument. There are a few different ways to specify column widths:
- First, there is
auto. This is the default behavior and tells Typst to grow the column to fit its contents. If there is not enough space, Typst will try its best to distribute the space among theauto-sized columns. - Lengths like
6cm,0.7in, or120pt. As usual, you can also use the font-dependentemunit. This is a multiple of your current font size. It’s useful if you want to size your table so that it always fits about the same amount of text, independent of font size. - A ratio in percent such as
40%. This will make the column take up 40% of the total horizontal space available to the table, so either the inner width of the page or the table’s container. You can also mix ratios and lengths into relative lengths. Be mindful that even if you specify a list of column widths that sum up to 100%, your table could still become larger than its container. This is because there can be gutter between columns that is not included in the column widths. If you want to make a table fill the page, the next option is often very useful. - A fractional part of the free space using the
frunit, such as1fr. This unit allows you to distribute the available space to columns. It works as follows: First, Typst sums up the lengths of all columns that do not usefrs. Then, it determines how much horizontal space is left. This horizontal space then gets distributed to all columns denominated infrs. During this process, a2frcolumn will become twice as wide as a1frcolumn. This is where the name comes from: The width of the column is its fraction of the total fractionally sized columns.
Let’s put this to use with a table that contains the dates, numbers, and descriptions of some routine checks. The first two columns are auto-sized and the last column is 1fr wide as to fill the whole page.
#table(
columns: (auto, auto, 1fr),
table.header[Date][°No][Description],
[24/01/03], [813], [Filtered participant pool],
[24/01/03], [477], [Transitioned to sec. regimen],
[24/01/11], [051], [Cycled treatment substrate],
)
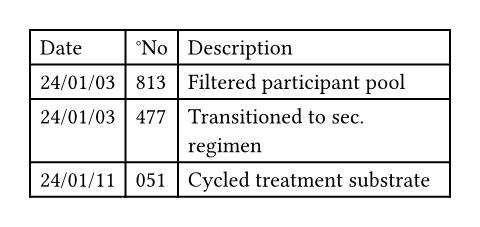
Here, we have passed our list of column lengths as an array, enclosed in round parentheses, with its elements separated by commas. The first two columns are automatically sized, so that they take on the size of their content and the third column is sized as 1fr so that it fills up the remainder of the space on the page. If you wanted to instead change the second column to be a bit more spacious, you could replace its entry in the columns array with a value like 6em.
How to caption and reference my table?
A table is just as valuable as the information your readers draw from it. You can enhance the effectiveness of both your prose and your table by making a clear connection between the two with a cross-reference. Typst can help you with automatic references and the figure function.
Just like with images, wrapping a table in the figure function allows you to add a caption and a label, so you can reference the figure elsewhere. Wrapping your table in a figure also lets you use the figure’s placement parameter to float it to the top or bottom of a page.
Let’s take a look at a captioned table and how to reference it in prose:
#show table.cell.where(y: 0): set text(weight: "bold")
#figure(
table(
columns: 4,
stroke: none,
table.header[Test Item][Specification][Test Result][Compliance],
[Voltage], [220V ± 5%], [218V], [Pass],
[Current], [5A ± 0.5A], [4.2A], [Fail],
),
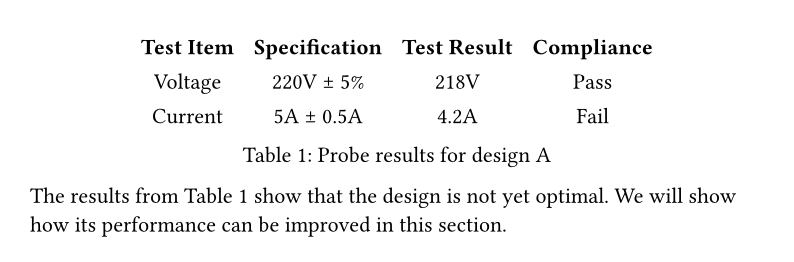
caption: [Probe results for design A],
) <probe-a>
The results from @probe-a show that the design is not yet optimal.
We will show how its performance can be improved in this section.
The example shows how to wrap a table in a figure, set a caption and a label, and how to reference that label. We start by using the figure function. It expects the contents of the figure as a positional argument. We just put the table function call in its argument list, omitting the # character because it is only needed when calling a function in markup mode. We also add the caption as a named argument (above or below) the table.
After the figure call, we put a label in angle brackets (<probe-a>). This tells Typst to remember this element and make it referenceable under this name throughout your document. We can then reference it in prose by using the at sign and the label name @probe-a. Typst will print a nicely formatted reference and automatically update the label if the table’s number changes.
How to get a striped table?
Many tables use striped rows or columns instead of strokes to differentiate between rows and columns. This effect is often called zebra stripes. Tables with zebra stripes are popular in Business and commercial Data Analytics applications, while academic applications tend to use strokes instead.
To add zebra stripes to a table, we use the table function’s fill argument. It can take three kinds of arguments:
- A single color (this can also be a gradient or a tiling) to fill all cells with. Because we want some cells to have another color, this is not useful if we want to build zebra tables.
- An array with colors which Typst cycles through for each column. We can use an array with two elements to get striped columns.
- A function that takes the horizontal coordinate
xand the vertical coordinateyof a cell and returns its fill. We can use this to create horizontal stripes or checkerboard patterns.
Let’s start with an example of a horizontally striped table:
#set text(font: "IBM Plex Sans")
// Medium bold table header.
#show table.cell.where(y: 0): set text(weight: "medium")
// Bold titles.
#show table.cell.where(x: 1): set text(weight: "bold")
// See the strokes section for details on this!
#let frame(stroke) = (x, y) => (
left: if x > 0 { 0pt } else { stroke },
right: stroke,
top: if y < 2 { stroke } else { 0pt },
bottom: stroke,
)
#set table(
fill: (rgb("EAF2F5"), none),
stroke: frame(1pt + rgb("21222C")),
)
#table(
columns: (0.4fr, 1fr, 1fr, 1fr),
table.header[Month][Title][Author][Genre],
[January], [The Great Gatsby], [F. Scott Fitzgerald], [Classic],
[February], [To Kill a Mockingbird], [Harper Lee], [Drama],
[March], [1984], [George Orwell], [Dystopian],
[April], [The Catcher in the Rye], [J.D. Salinger], [Coming-of-Age],
)
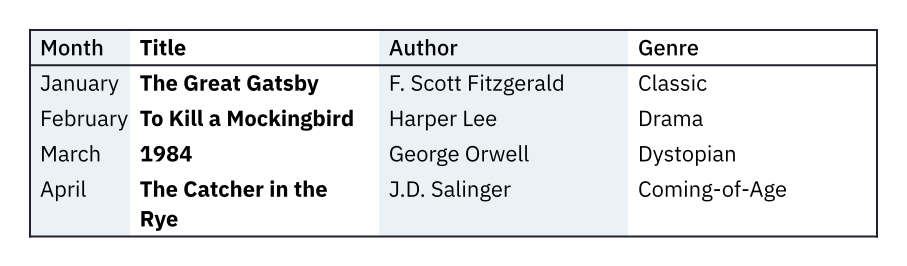
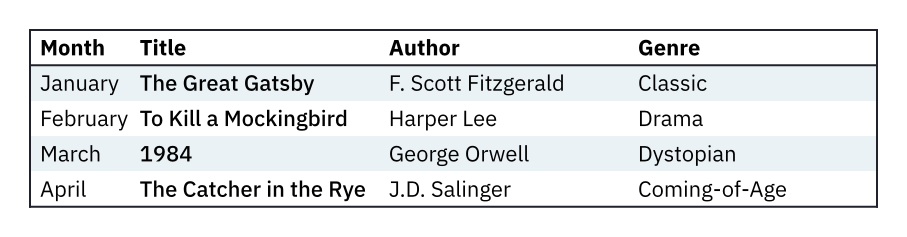
This example shows a book club reading list. The line fill: (rgb("EAF2F5"), none) in table’s set rule is all that is needed to add striped columns. It tells Typst to alternate between coloring columns with a light blue (in the rgb function call) and nothing (none). Note that we extracted all of our styling from the table function call itself into set and show rules, so that we can automatically reuse it for multiple tables.
Because setting the stripes itself is easy we also added some other styles to make it look nice. The other code in the example provides a dark blue stroke around the table and below the first line and emboldens the first row and the column with the book title. See the strokes section for details on how we achieved this stroke configuration.
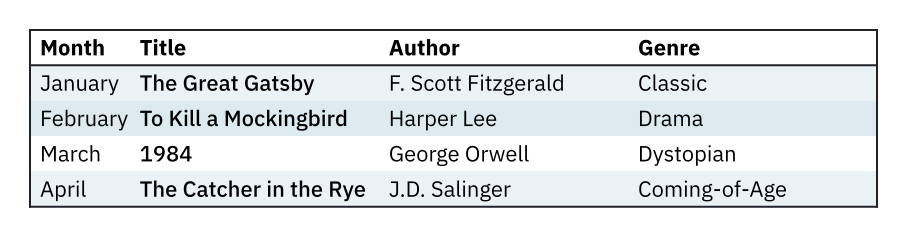
Let’s next take a look at how we can change only the set rule to achieve horizontal stripes instead:
#set table(
fill: (_, y) => if calc.odd(y) { rgb("EAF2F5") },
stroke: frame(1pt + rgb("21222C")),
)
We just need to replace the set rule from the previous example with this one and get horizontal stripes instead. Here, we are passing a function to fill. It discards the horizontal coordinate with an underscore and then checks if the vertical coordinate y of the cell is odd. If so, the cell gets a light blue fill, otherwise, no fill is returned.
Of course, you can make this function arbitrarily complex. For example, if you want to stripe the rows with a light and darker shade of blue, you could do something like this:
#set table(
fill: (_, y) => (none, rgb("EAF2F5"), rgb("DDEAEF")).at(calc.rem(y, 3)),
stroke: frame(1pt + rgb("21222C")),
)
This example shows an alternative approach to write our fill function. The function uses an array with three colors and then cycles between its values for each row by indexing the array with the remainder of y divided by 3.
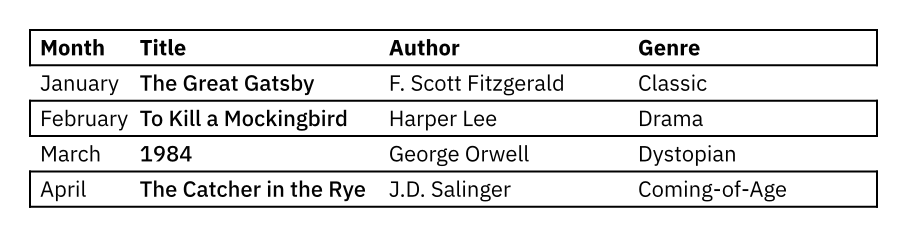
Finally, here is a bonus example that uses the stroke to achieve striped rows:
#set table(
stroke: (x, y) => (
y: 1pt,
left: if x > 0 { 0pt } else if calc.even(y) { 1pt },
right: if calc.even(y) { 1pt },
),
)
Manually overriding a cell’s fill color
Sometimes, the fill of a cell needs not to vary based on its position in the table, but rather based on its contents. We can use the table.cell element in the table’s parameter list to wrap a cell’s content and override its fill.
For example, here is a list of all German presidents, with the cell borders colored in the color of their party.
#set text(font: "Roboto")
#let cdu(name) = ([CDU], table.cell(fill: black, text(fill: white, name)))
#let spd(name) = ([SPD], table.cell(fill: red, text(fill: white, name)))
#let fdp(name) = ([FDP], table.cell(fill: yellow, name))
#table(
columns: (auto, auto, 1fr),
stroke: (x: none),
table.header[Tenure][Party][President],
[1949-1959], ..fdp[Theodor Heuss],
[1959-1969], ..cdu[Heinrich Lübke],
[1969-1974], ..spd[Gustav Heinemann],
[1974-1979], ..fdp[Walter Scheel],
[1979-1984], ..cdu[Karl Carstens],
[1984-1994], ..cdu[Richard von Weizsäcker],
[1994-1999], ..cdu[Roman Herzog],
[1999-2004], ..spd[Johannes Rau],
[2004-2010], ..cdu[Horst Köhler],
[2010-2012], ..cdu[Christian Wulff],
[2012-2017], [n/a], [Joachim Gauck],
[2017-], ..spd[Frank-Walter-Steinmeier],
)
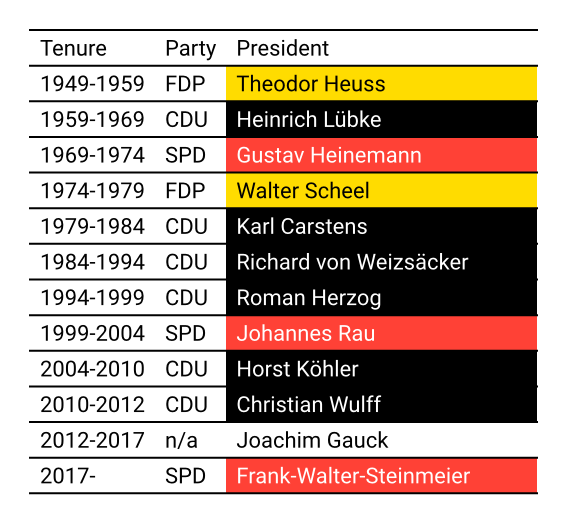
In this example, we make use of variables because there only have been a total of three parties whose members have become president (and one unaffiliated president). Their colors will repeat multiple times, so we store a function that produces an array with their party’s name and a table cell with that party’s color and the president’s name (cdu, spd, and fdp). We then use these functions in the table argument list instead of directly adding the name. We use the spread operator .. to turn the items of the arrays into single cells. We could also write something like [FDP], table.cell(fill: yellow)[Theodor Heuss] for each cell directly in the table’s argument list, but that becomes unreadable, especially for the parties whose colors are dark so that they require white text. We also delete vertical strokes and set the font to Roboto.
The party column and the cell color in this example communicate redundant information on purpose: Communicating important data using color only is a bad accessibility practice. It disadvantages users with vision impairment and is in violation of universal access standards, such as the WCAG 2.1 Success Criterion 1.4.1. To improve this table, we added a column printing the party name. Alternatively, you could have made sure to choose a color-blindness friendly palette and mark up your cells with an additional label that screen readers can read out loud. The latter feature is not currently supported by Typst, but will be added in a future release. You can check how colors look for color-blind readers with this Chrome extension, Photoshop, or GIMP.
How to adjust the lines in a table?
By default, Typst adds strokes between each row and column of a table. You can adjust these strokes in a variety of ways. Which one is the most practical, depends on the modification you want to make and your intent:
- Do you want to style all tables in your document, irrespective of their size and content? Use the
tablefunction’s stroke argument in a set rule. - Do you want to customize all lines in a single table? Use the
tablefunction’s stroke argument when calling the table function. - Do you want to change, add, or remove the stroke around a single cell? Use the
table.cellelement in the argument list of your table call. - Do you want to change, add, or remove a single horizontal or vertical stroke in a single table? Use the
table.hlineandtable.vlineelements in the argument list of your table call.
We will go over all of these options with examples next! First, we will tackle the table function’s stroke argument. Here, you can adjust both how the table’s lines get drawn and configure which lines are drawn at all.
Let’s start by modifying the color and thickness of the stroke:
#table(
columns: 4,
stroke: 0.5pt + rgb("666675"),
[*Monday*], [11.5], [13.0], [4.0],
[*Tuesday*], [8.0], [14.5], [5.0],
[*Wednesday*], [9.0], [18.5], [13.0],
)
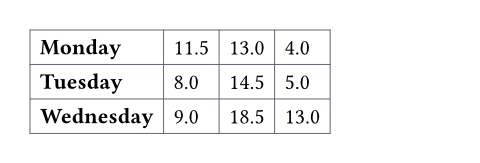
This makes the table lines a bit less wide and uses a bluish gray. You can see that we added a width in point to a color to achieve our customized stroke. This addition yields a value of the stroke type. Alternatively, you can use the dictionary representation for strokes which allows you to access advanced features such as dashed lines.
The previous example showed how to use the stroke argument in the table function’s invocation. Alternatively, you can specify the stroke argument in the table’s set rule. This will have exactly the same effect on all subsequent table calls as if the stroke argument was specified in the argument list. This is useful if you are writing a template or want to style your whole document.
// Renders the exact same as the last example
#set table(stroke: 0.5pt + rgb("666675"))

#table(
  columns: 4,
  [*Monday*], [11.5], [13.0], [4.0],
  [*Tuesday*], [8.0], [14.5], [5.0],
  [*Wednesday*], [9.0], [18.5], [13.0],
)
For small tables, you sometimes want to suppress all strokes because they add too much visual noise. To do this, just set the stroke argument to none:
#table(
columns: 4,
stroke: none,
[*Monday*], [11.5], [13.0], [4.0],
[*Tuesday*], [8.0], [14.5], [5.0],
[*Wednesday*], [9.0], [18.5], [13.0],
)

If you want more fine-grained control of where lines get placed in your table, you can also pass a dictionary with the keys top, left, right, bottom (controlling the respective cell sides), x, y (controlling vertical and horizontal strokes), and rest (covers all strokes not styled by other dictionary entries). All keys are optional; omitted keys will use their previously set value, or the default value if never set. For example, to get a table with only horizontal lines, you can do this:
#table(
columns: 2,
stroke: (x: none),
align: horizon,
[☒], [Close cabin door],
[☐], [Start engines],
[☐], [Radio tower],
[☐], [Push back],
)
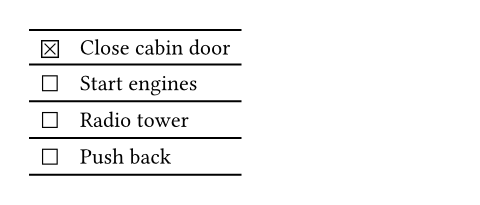
This turns off all vertical strokes and leaves the horizontal strokes in place. To achieve the reverse effect (only vertical strokes), set the stroke argument to (y: none) instead.
Further down in the guide, we cover how to use a function in the stroke argument to customize all strokes individually. This is how you achieve more complex stroking patterns.
Adding individual lines in the table
If you want to add a single horizontal or vertical line in your table, for example to separate a group of rows, you can use the table.hline and table.vline elements for horizontal and vertical lines, respectively. Add them to the argument list of the table function just like you would add individual cells and a header.
Let’s take a look at the following example from the reference:
#set table.hline(stroke: 0.6pt)
#table(
stroke: none,
columns: (auto, 1fr),
// Morning schedule abridged.
[14:00], [Talk: Tracked Layout],
[15:00], [Talk: Automations],
[16:00], [Workshop: Tables],
table.hline(),
[19:00], [Day 1 Attendee Mixer],
)
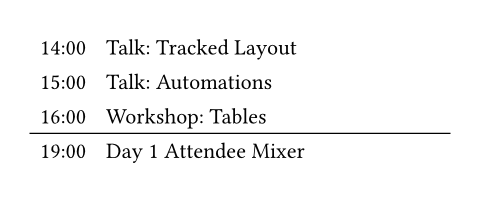
In this example, you can see that we have placed a call to table.hline between the cells, producing a horizontal line at that spot. We also used a set rule on the element to reduce its stroke width to make it fit better with the weight of the font.
By default, Typst places horizontal and vertical lines after the current row or column, depending on their position in the argument list. You can also manually move them to a different position by adding the y (for hline) or x (for vline) argument. For example, the code below would produce the same result:
#set table.hline(stroke: 0.6pt)

#table(
  stroke: none,
  columns: (auto, 1fr),
  // Morning schedule abridged.
  table.hline(y: 3),
  [14:00], [Talk: Tracked Layout],
  [15:00], [Talk: Automations],
  [16:00], [Workshop: Tables],
  [19:00], [Day 1 Attendee Mixer],
)
Let’s imagine you are working with a template that shows none of the table strokes except for one between the first and second row. Now, since you have one table that also has labels in the first column, you want to add an extra vertical line to it. However, you do not want this vertical line to cross into the top row. You can achieve this with the start argument:
// Base template already configured tables, but we need some
// extra configuration for this table.
#{
set table(align: (x, _) => if x == 0 { left } else { right })
show table.cell.where(x: 0): smallcaps
table(
columns: (auto, 1fr, 1fr, 1fr),
table.vline(x: 1, start: 1),
table.header[Trainset][Top Speed][Length][Weight],
[TGV Réseau], [320 km/h], [200m], [383t],
[ICE 403], [330 km/h], [201m], [409t],
[Shinkansen N700], [300 km/h], [405m], [700t],
)
}
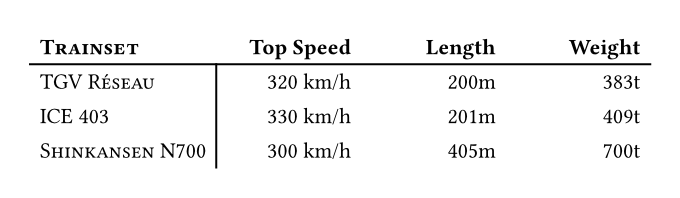
In this example, we have added table.vline at the start of our positional argument list. But because the line is not supposed to go to the left of the first column, we specified the x argument as 1. We also set the start argument to 1 so that the line does only start after the first row.
The example also contains two more things: We use the align argument with a function to right-align the data in all but the first column and use a show rule to make the first column of table cells appear in small capitals. Because these styles are specific to this one table, we put everything into a code block, so that the styling does not affect any further tables.
Overriding the strokes of a single cell
Imagine you want to change the stroke around a single cell. Maybe your cell is very important and needs highlighting! For this scenario, there is the table.cell function. Instead of adding your content directly in the argument list of the table, you wrap it in a table.cell call. Now, you can use table.cell’s argument list to override the table properties, such as the stroke, for this cell only.
Here’s an example with a matrix of two of the Big Five personality factors, with one intersection highlighted.
#table(
columns: 3,
stroke: (x: none),
table.header[][*High Neuroticism*][*Low Neuroticism*],
[*High Agreeableness*],
table.cell(stroke: orange + 2pt)[
_Sensitive_ \ Prone to emotional distress but very empathetic.
],
[_Compassionate_ \ Caring and stable, often seen as a supportive figure.],
[*Low Agreeableness*],
[_Contentious_ \ Competitive and easily agitated.],
[_Detached_ \ Independent and calm, may appear aloof.],
)
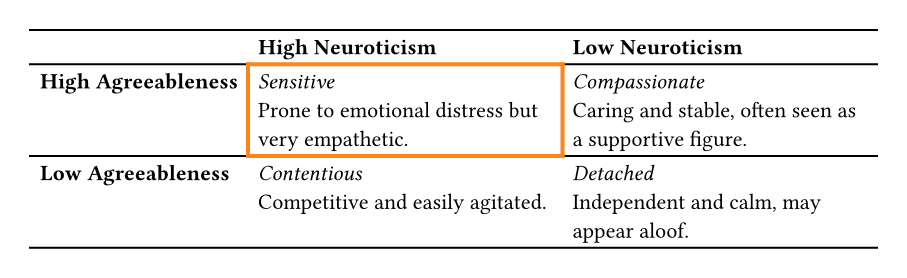
Above, you can see that we used the table.cell element in the table’s argument list and passed the cell content to it. We have used its stroke argument to set a wider orange stroke. Despite the fact that we disabled vertical strokes on the table, the orange stroke appeared on all sides of the modified cell, showing that the table’s stroke configuration is overwritten.
Complex document-wide stroke customization
This section explains how to customize all lines at once in one or multiple tables. This allows you to draw only the first horizontal line or omit the outer lines, without knowing how many cells the table has. This is achieved by providing a function to the table’s stroke parameter. The function should return a stroke given the zero-indexed x and y position of the current cell. You should only need these functions if you are a template author, do not use a template, or need to heavily customize your tables. Otherwise, your template should set appropriate default table strokes.
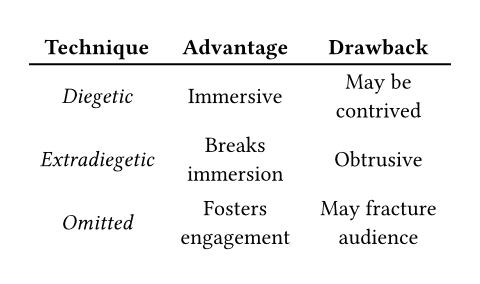
For example, this is a set rule that draws all horizontal lines except for the very first and last line.
#show table.cell.where(x: 0): set text(style: "italic")
#show table.cell.where(y: 0): set text(style: "normal", weight: "bold")
#set table(stroke: (_, y) => if y > 0 { (top: 0.8pt) })
#table(
columns: 3,
align: center + horizon,
table.header[Technique][Advantage][Drawback],
[Diegetic], [Immersive], [May be contrived],
[Extradiegetic], [Breaks immersion], [Obtrusive],
[Omitted], [Fosters engagement], [May fracture audience],
)

In the set rule, we pass a function that receives two arguments, assigning the vertical coordinate to y and discarding the horizontal coordinate. It then returns a stroke dictionary with a 0.8pt top stroke for all but the first line. The cells in the first line instead implicitly receive none as the return value. You can easily modify this function to just draw the inner vertical lines instead as (x, _) => if x > 0 { (left: 0.8pt) }.
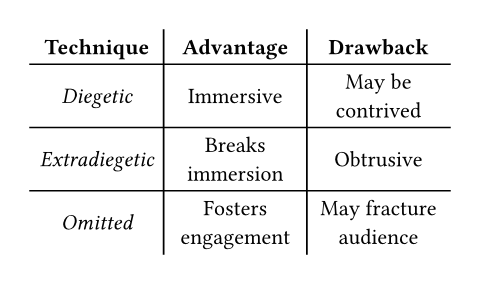
Let’s try a few more stroking functions. The next function will only draw a line below the first row:
#set table(stroke: (_, y) => if y == 0 { (bottom: 1pt) })
// Table as seen above
If you understood the first example, it becomes obvious what happens here. We check if we are in the first row. If so, we return a bottom stroke. Otherwise, we’ll return none implicitly.
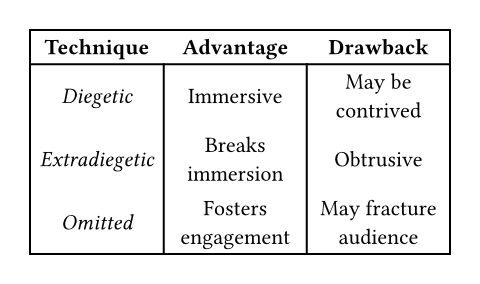
The next example shows how to draw all but the outer lines:
#set table(stroke: (x, y) => (
left: if x > 0 { 0.8pt },
top: if y > 0 { 0.8pt },
))
// Table as seen above
This example uses both the x and y coordinates. It omits the left stroke in the first column and the top stroke in the first row. The right and bottom lines are not drawn.
Finally, here is a table that draws all lines except for the vertical lines in the first row and horizontal lines in the table body. It looks a bit like a calendar.
#set table(stroke: (x, y) => (
left: if x == 0 or y > 0 { 1pt } else { 0pt },
right: 1pt,
top: if y <= 1 { 1pt } else { 0pt },
bottom: 1pt,
))
// Table as seen above
This example is a bit more complex. We start by drawing all the strokes on the right of the cells. But this means that we have drawn strokes in the top row, too, and we don’t need those! We use the fact that left will override right and only draw the left line if we are not in the first row or if we are in the first column. In all other cases, we explicitly remove the left line. Finally, we draw the horizontal lines by first setting the bottom line and then for the first two rows with the top key, suppressing all other top lines. The last line appears because there is no top line that could suppress it.
How to achieve a double line?
Typst does not yet have a native way to draw double strokes, but there are multiple ways to emulate them, for example with tilings. We will show a different workaround in this section: Table gutters.
Tables can space their cells apart using the gutter argument. When a gutter is applied, a stroke is drawn on each of the now separated cells. We can selectively add gutter between the rows or columns for which we want to draw a double line. The row-gutter and column-gutter arguments allow us to do this. They accept arrays of gutter values. Let’s take a look at an example:
#table(
columns: 3,
stroke: (x: none),
row-gutter: (2.2pt, auto),
table.header[Date][Exercise Type][Calories Burned],
[2023-03-15], [Swimming], [400],
[2023-03-17], [Weightlifting], [250],
[2023-03-18], [Yoga], [200],
)
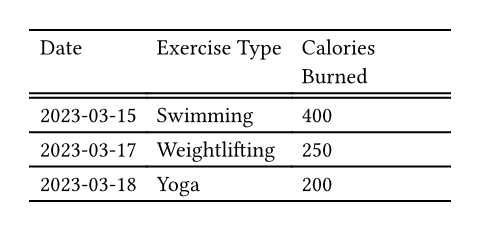
We can see that we used an array for row-gutter that specifies a 2.2pt gap between the first and second row. It then continues with auto (which is the default, in this case 0pt gutter) which will be the gutter between all other rows, since it is the last entry in the array.
How to align the contents of the cells in my table?
You can use multiple mechanisms to align the content in your table. You can either use the table function’s align argument to set the alignment for your whole table (or use it in a set rule to set the alignment for tables throughout your document) or the align function (or table.cell’s align argument) to override the alignment of a single cell.
When using the table function’s align argument, you can choose between three methods to specify an alignment:
- Just specify a single alignment like
right(aligns in the top-right corner) orcenter + horizon(centers all cell content). This changes the alignment of all cells. - Provide an array. Typst will cycle through this array for each column.
- Provide a function that is passed the horizontal
xand verticalycoordinate of a cell and returns an alignment.
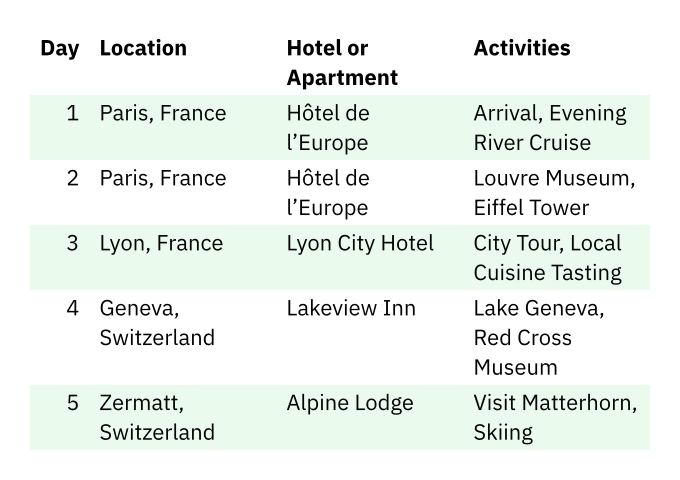
For example, this travel itinerary right-aligns the day column and left-aligns everything else by providing an array in the align argument:
#set text(font: "IBM Plex Sans")
#show table.cell.where(y: 0): set text(weight: "bold")
#table(
columns: 4,
align: (right, left, left, left),
fill: (_, y) => if calc.odd(y) { green.lighten(90%) },
stroke: none,
table.header[Day][Location][Hotel or Apartment][Activities],
[1], [Paris, France], [Hôtel de l'Europe], [Arrival, Evening River Cruise],
[2], [Paris, France], [Hôtel de l'Europe], [Louvre Museum, Eiffel Tower],
[3], [Lyon, France], [Lyon City Hotel], [City Tour, Local Cuisine Tasting],
[4], [Geneva, Switzerland], [Lakeview Inn], [Lake Geneva, Red Cross Museum],
[5], [Zermatt, Switzerland], [Alpine Lodge], [Visit Matterhorn, Skiing],
)
However, this example does not yet look perfect — the header cells should be bottom-aligned. Let’s use a function instead to do so:
#set text(font: "IBM Plex Sans")
#show table.cell.where(y: 0): set text(weight: "bold")
#table(
columns: 4,
align: (x, y) =>
if x == 0 { right } else { left } +
if y == 0 { bottom } else { top },
fill: (_, y) => if calc.odd(y) { green.lighten(90%) },
stroke: none,
table.header[Day][Location][Hotel or Apartment][Activities],
[1], [Paris, France], [Hôtel de l'Europe], [Arrival, Evening River Cruise],
[2], [Paris, France], [Hôtel de l'Europe], [Louvre Museum, Eiffel Tower],
// ... remaining days omitted
)
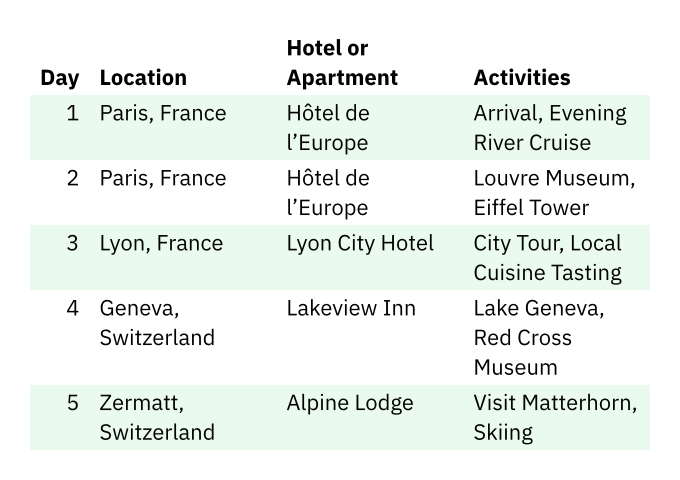
In the function, we calculate a horizontal and vertical alignment based on whether we are in the first column (x == 0) or the first row (y == 0). We then make use of the fact that we can add horizontal and vertical alignments with + to receive a single, two-dimensional alignment.
You can find an example of using table.cell to change a single cell’s alignment on its reference page.
How to merge cells?
When a table contains logical groupings or the same data in multiple adjacent cells, merging multiple cells into a single, larger cell can be advantageous. Another use case for cell groups are table headers with multiple rows: That way, you can group for example a sales data table by quarter in the first row and by months in the second row.
A merged cell spans multiple rows and/or columns. You can achieve it with the table.cell function’s rowspan and colspan arguments: Just specify how many rows or columns you want your cell to span.
The example below contains an attendance calendar for an office with in-person and remote days for each team member. To make the table more glanceable, we merge adjacent cells with the same value:
#let ofi = [Office]
#let rem = [_Remote_]
#let lea = [*On leave*]
#show table.cell.where(y: 0): set text(
fill: white,
weight: "bold",
)
#table(
columns: 6 * (1fr,),
align: (x, y) => if x == 0 or y == 0 { left } else { center },
stroke: (x, y) => (
// Separate black cells with white strokes.
left: if y == 0 and x > 0 { white } else { black },
rest: black,
),
fill: (_, y) => if y == 0 { black },
table.header(
[Team member],
[Monday],
[Tuesday],
[Wednesday],
[Thursday],
[Friday]
),
[Evelyn Archer],
table.cell(colspan: 2, ofi),
table.cell(colspan: 2, rem),
ofi,
[Lila Montgomery],
table.cell(colspan: 5, lea),
[Nolan Pearce],
rem,
table.cell(colspan: 2, ofi),
rem,
ofi,
)
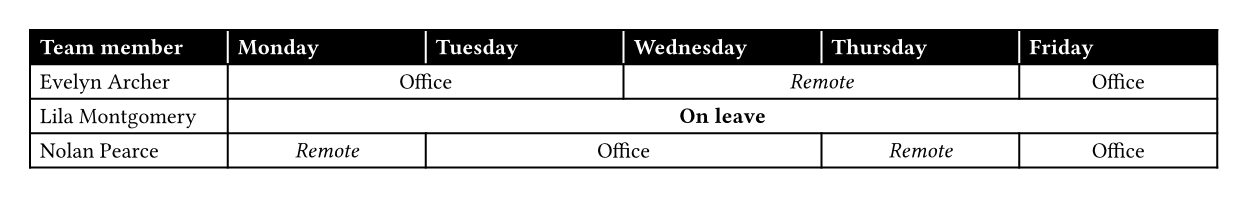
In the example, we first define variables with “Office”, “Remote”, and “On leave” so we don’t have to write these labels out every time. We can then use these variables in the table body either directly or in a table.cell call if the team member spends multiple consecutive days in office, remote, or on leave.
The example also contains a black header (created with table’s fill argument) with white strokes (table’s stroke argument) and white text (set by the table.cell set rule). Finally, we align all the content of all table cells in the body in the center. If you want to know more about the functions passed to align, stroke, and fill, you can check out the sections on alignment, strokes, and striped tables.
This table would be a great candidate for fully automated generation from an external data source! Check out the section about importing data to learn more about that.
How to rotate a table?
When tables have many columns, a portrait paper orientation can quickly get cramped. Hence, you’ll sometimes want to switch your tables to landscape orientation. There are two ways to accomplish this in Typst:
- If you want to rotate only the table but not the other content of the page and the page itself, use the
rotatefunction with thereflowargument set totrue. - If you want to rotate the whole page the table is on, you can use the
pagefunction with itsflippedargument set totrue. The header, footer, and page number will now also appear on the long edge of the page. This has the advantage that the table will appear right side up when read on a computer, but it also means that a page in your document has different dimensions than all the others, which can be jarring to your readers.
Below, we will demonstrate both techniques with a student grade book table.
First, we will rotate the table on the page. The example also places some text on the right of the table.
#set page("a5", columns: 2, numbering: "— 1 —")
#show table.cell.where(y: 0): set text(weight: "bold")
#rotate(
-90deg,
reflow: true,
table(
columns: (1fr,) + 5 * (auto,),
inset: (x: 0.6em,),
stroke: (_, y) => (
x: 1pt,
top: if y <= 1 { 1pt } else { 0pt },
bottom: 1pt,
),
align: (left, right, right, right, right, left),
table.header(
[Student Name],
[Assignment 1], [Assignment 2],
[Mid-term], [Final Exam],
[Total Grade],
),
[Jane Smith], [78%], [82%], [75%], [80%], [B],
[Alex Johnson], [90%], [95%], [94%], [96%], [A+],
[John Doe], [85%], [90%], [88%], [92%], [A],
[Maria Garcia], [88%], [84%], [89%], [85%], [B+],
[Zhang Wei], [93%], [89%], [90%], [91%], [A-],
[Marina Musterfrau], [96%], [91%], [74%], [69%], [B-],
),
)
#lorem(80)
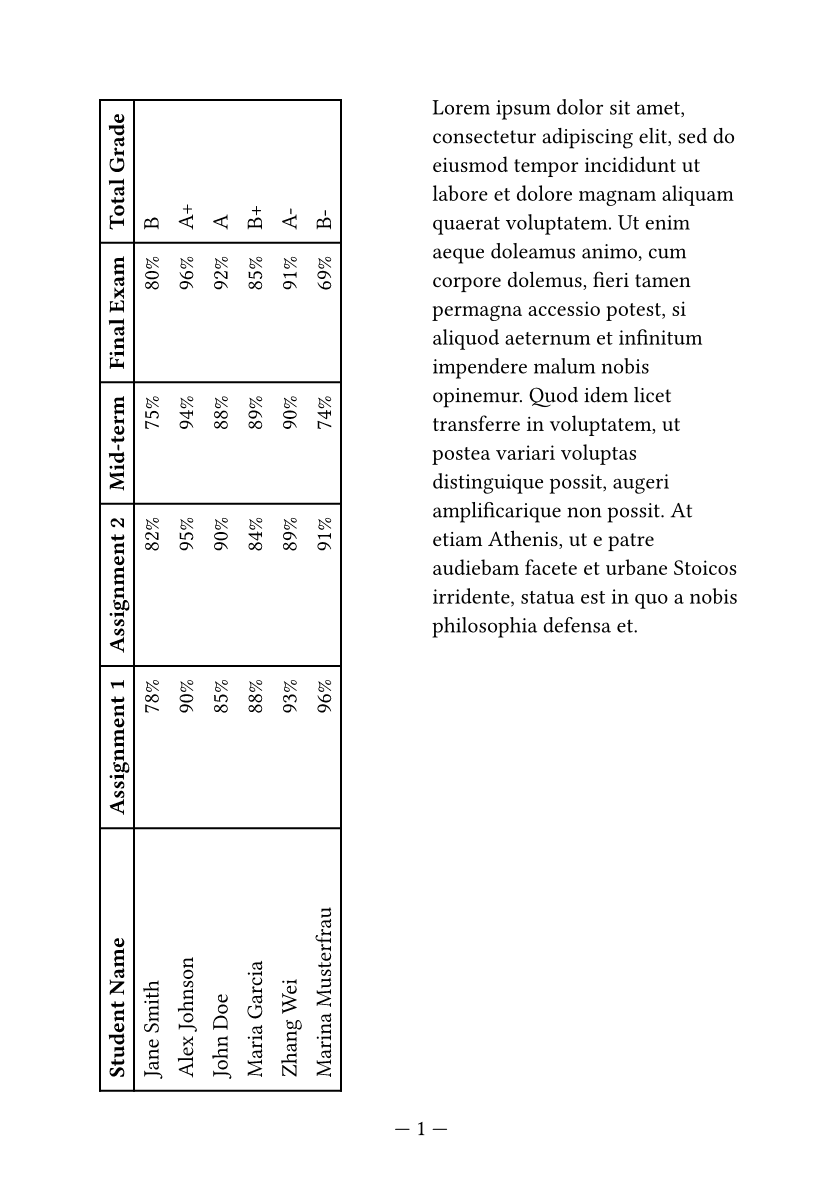
What we have here is a two-column document on ISO A5 paper with page numbers on the bottom. The table has six columns and contains a few customizations to stroke, alignment and spacing. But the most important part is that the table is wrapped in a call to the rotate function with the reflow argument being true. This will make the table rotate 90 degrees counterclockwise. The reflow argument is needed so that the table’s rotation affects the layout. If it was omitted, Typst would lay out the page as if the table was not rotated (true might become the default in the future).
The example also shows how to produce many columns of the same size: To the initial 1fr column, we add an array with five auto items that we create by multiplying an array with one auto item by five. Note that arrays with just one item need a trailing comma to distinguish them from merely parenthesized expressions.
The second example shows how to rotate the whole page, so that the table stays upright:
#set page("a5", numbering: "— 1 —")
#show table.cell.where(y: 0): set text(weight: "bold")
#page(flipped: true)[
#table(
columns: (1fr,) + 5 * (auto,),
inset: (x: 0.6em,),
stroke: (_, y) => (
x: 1pt,
top: if y <= 1 { 1pt } else { 0pt },
bottom: 1pt,
),
align: (left, right, right, right, right, left),
table.header(
[Student Name],
[Assignment 1], [Assignment 2],
[Mid-term], [Final Exam],
[Total Grade],
),
[Jane Smith], [78%], [82%], [75%], [80%], [B],
[Alex Johnson], [90%], [95%], [94%], [96%], [A+],
[John Doe], [85%], [90%], [88%], [92%], [A],
[Maria Garcia], [88%], [84%], [89%], [85%], [B+],
[Zhang Wei], [93%], [89%], [90%], [91%], [A-],
[Marina Musterfrau], [96%], [91%], [74%], [69%], [B-],
)
#pad(x: 15%, top: 1.5em)[
= Winter 2023/24 results
#lorem(80)
]
]
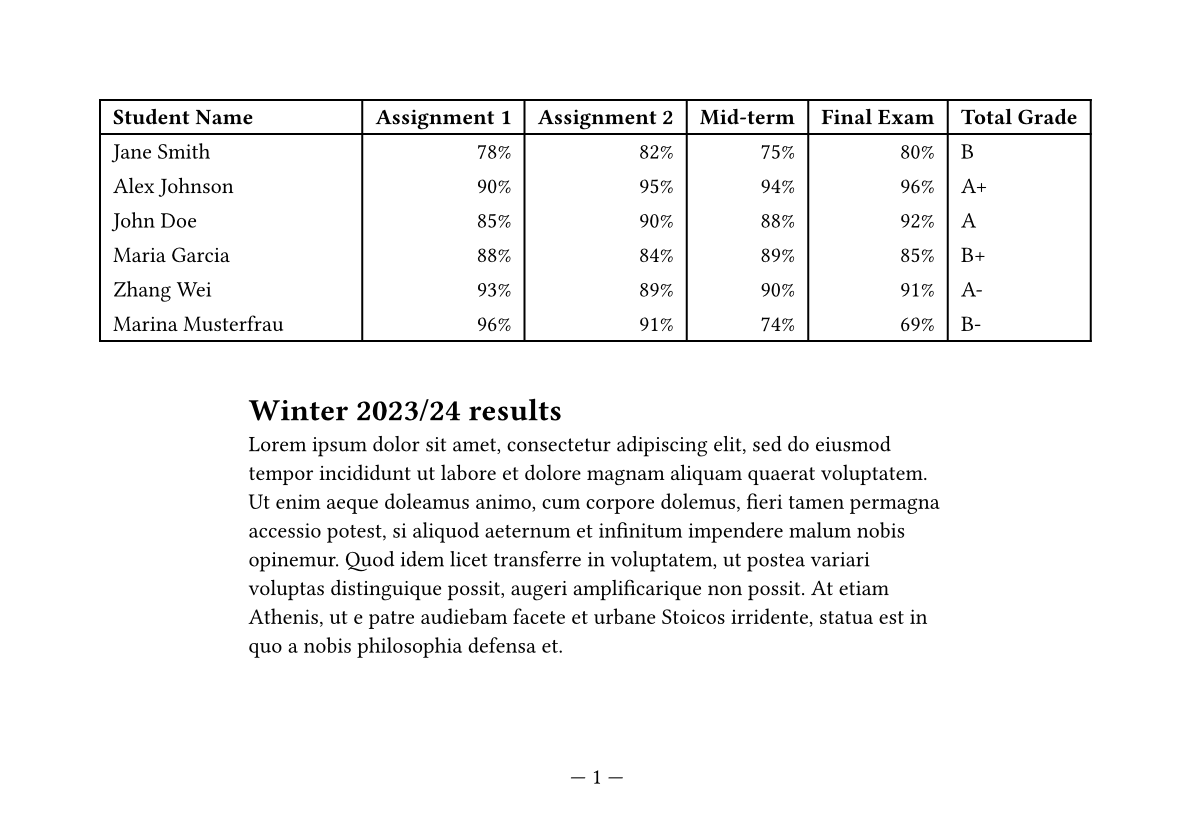
Here, we take the same table and the other content we want to set with it and put it into a call to the page function while supplying true to the flipped argument. This will instruct Typst to create new pages with width and height swapped and place the contents of the function call onto a new page. Notice how the page number is also on the long edge of the paper now. At the bottom of the page, we use the pad function to constrain the width of the paragraph to achieve a nice and legible line length.
How to break a table across pages?
It is best to contain a table on a single page. However, some tables just have many rows, so breaking them across pages becomes unavoidable. Fortunately, Typst supports breaking tables across pages out of the box. If you are using the table.header and table.footer functions, their contents will be repeated on each page as the first and last rows, respectively. If you want to disable this behavior, you can set repeat to false on either of them.
If you have placed your table inside of a figure, it becomes unable to break across pages by default. However, you can change this behavior. Let’s take a look:
#set page(width: 9cm, height: 6cm)
#show table.cell.where(y: 0): set text(weight: "bold")
#show figure: set block(breakable: true)
#figure(
caption: [Training regimen for Marathon],
table(
columns: 3,
fill: (_, y) => if y == 0 { gray.lighten(75%) },
table.header[Week][Distance (km)][Time (hh:mm:ss)],
[1], [5], [00:30:00],
[2], [7], [00:45:00],
[3], [10], [01:00:00],
[4], [12], [01:10:00],
[5], [15], [01:25:00],
[6], [18], [01:40:00],
[7], [20], [01:50:00],
[8], [22], [02:00:00],
[...], [...], [...],
table.footer[_Goal_][_42.195_][_02:45:00_],
)
)
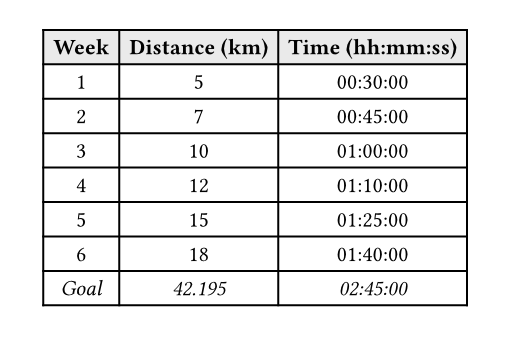
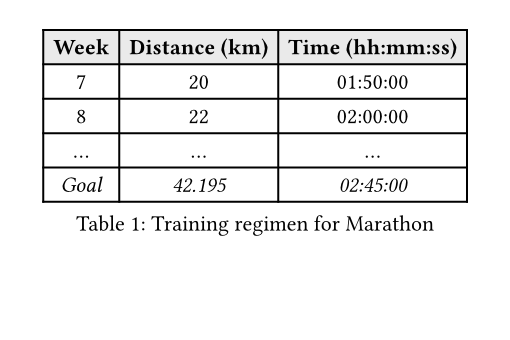
A figure automatically produces a block which cannot break by default. However, we can reconfigure the block of the figure using a show rule to make it breakable. Now, the figure spans multiple pages with the headers and footers repeating.
How to import data into a table?
Often, you need to put data that you obtained elsewhere into a table. Sometimes, this is from Microsoft Excel or Google Sheets, sometimes it is from a dataset on the web or from your experiment. Fortunately, Typst can load many common file formats, so you can use scripting to include their data in a table.
The most common file format for tabular data is CSV. You can obtain a CSV file from Excel by choosing “Save as” in the File menu and choosing the file format “CSV UTF-8 (Comma-delimited) (.csv)”. Save the file and, if you are using the web app, upload it to your project.
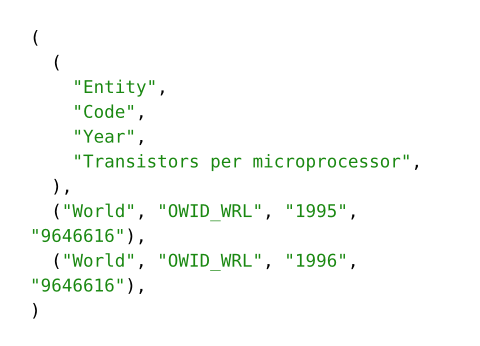
In our case, we will be building a table about Moore’s Law. For this purpose, we are using a statistic with how many transistors the average microprocessor consists of per year from Our World in Data. Let’s start by pressing the “Download” button to get a CSV file with the raw data.
Be sure to move the file to your project or somewhere Typst can see it, if you are using the CLI. Once you did that, we can open the file to see how it is structured:
Entity,Code,Year,Transistors per microprocessor
World,OWID_WRL,1971,2308.2417
World,OWID_WRL,1972,3554.5222
World,OWID_WRL,1974,6097.5625
The file starts with a header and contains four columns: Entity (which is to whom the metric applies), Code, the year, and the number of transistors per microprocessor. Only the last two columns change between each row, so we can disregard “Entity” and “Code”.
First, let’s start by loading this file with the csv function. It accepts the file name of the file we want to load as a string argument:
#let moore = csv("moore.csv")We have loaded our file (assuming we named it moore.csv) and bound it to the new variable moore. This will not produce any output, so there’s nothing to see yet. If we want to examine what Typst loaded, we can either hover the name of the variable in the web app or print some items from the array:
#let moore = csv("moore.csv")
#moore.slice(0, 3)
With the arguments (0, 3), the slice method returns the first three items in the array (with the indices 0, 1, and 2). We can see that each row is its own array with one item per cell.
Now, let’s write a loop that will transform this data into an array of cells that we can use with the table function.
#let moore = csv("moore.csv")
#table(
columns: 2,
..for (.., year, count) in moore {
(year, count)
}
)

The example above uses a for loop that iterates over the rows in our CSV file and returns an array for each iteration. We use the for loop’s destructuring capability to discard all but the last two items of each row. We then create a new array with just these two. Because Typst will concatenate the array results of all the loop iterations, we get a one-dimensional array in which the year column and the number of transistors alternate. We can then insert the array as cells. For this we use the spread operator (..). By prefixing an array, or, in our case an expression that yields an array, with two dots, we tell Typst that the array’s items should be used as positional arguments.
Alternatively, we can also use the map, slice, and flatten array methods to write this in a more functional style:
#let moore = csv("moore.csv")

#table(
   columns: 2,
   ..moore.map(m => m.slice(2, 4)).flatten(),
)
This example renders the same as the previous one, but we first load the CSV and then transform each row using map. The function we pass to map is applied to each row of the data and returns a new array that replaces the original row. Here, we use .slice(2, 4) to extract only the third and fourth column, since these are the ones we want to keep. Because moore is a two-dimensional array (each row is itself an array), the result of mapping is still a nested array. The flatten function converts this nested structure into a one-dimensional array, which is required when spreading the data into the table function. Finally, we explicitly specify columns: 2 because we are keeping exactly two columns from each row.
Now that we have nice code for our table, we should try to also make the table itself nice! The transistor counts go from millions in 1995 to trillions in 2021 and changes are difficult to see with so many digits. We could try to present our data logarithmically to make it more digestible:
#let moore = csv("moore.csv")
#let moore-log = moore.slice(1).map(m => {
let (.., year, count) = m
let log = calc.log(float(count))
let rounded = str(calc.round(log, digits: 2))
(year, rounded)
})
#show table.cell.where(x: 0): strong
#table(
columns: moore-log.first().len(),
align: right,
fill: (_, y) => if calc.odd(y) { rgb("D7D9E0") },
stroke: none,
table.header[Year][Transistor count ($log_10$)],
table.hline(stroke: rgb("4D4C5B")),
..moore-log.flatten(),
)
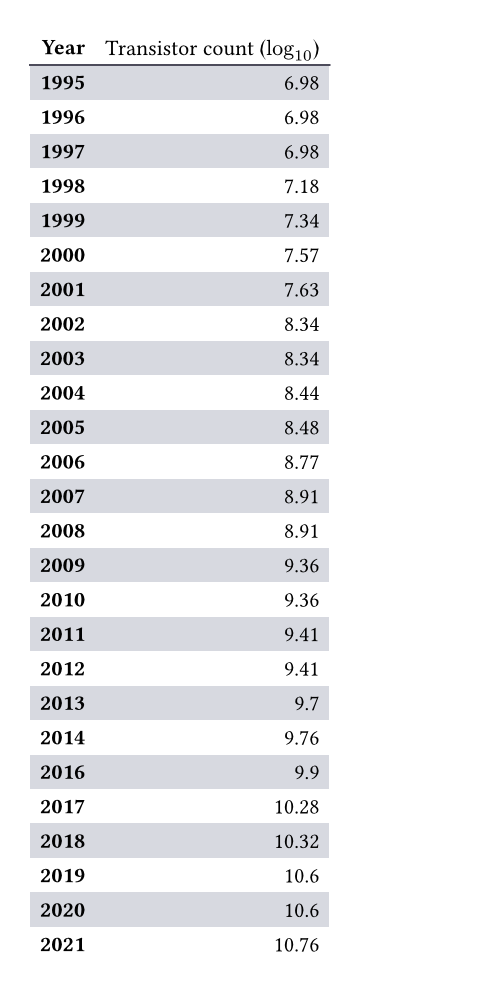
In this example, we first drop the header row from the data since we are adding our own. Then, we discard all but the last two columns as above. We do this by destructuring the array m, discarding all but the two last items. We then convert the string in count to a floating point number, calculate its logarithm and store it in the variable log. Finally, we round it to two digits, convert it to a string, and store it in the variable rounded. Then, we return an array with year and rounded that replaces the original row. In our table, we have added our custom header that tells the reader that we’ve applied a logarithm to the values. Then, we spread the flattened data as above.
We also styled the table with stripes, a horizontal line below the first row, aligned everything to the right, and emboldened the first column. Click on the links to go to the relevant guide sections and see how it’s done!
What if I need the table function for something that isn’t a table?
Tabular layouts of content can be useful not only for matrices of closely related data, like shown in the examples throughout this guide, but also for presentational purposes. Typst differentiates between grids that are for layout and presentational purposes only and tables, in which the arrangement of the cells itself conveys information.
To make this difference clear to other software and allow templates to heavily style tables, Typst has two functions for grid and table layout:
- The
tablefunction explained throughout this guide which is intended for tabular data. - The
gridfunction which is intended for presentational purposes and page layout.
Both elements work the same way and have the same arguments. You can apply everything you have learned about tables in this guide to grids. There are only three differences:
- You’ll need to use the
grid.cell,grid.vline, andgrid.hlineelements instead oftable.cell,table.vline, andtable.hline. - The grid has different defaults: It draws no strokes by default and has no spacing (
inset) inside of its cells. - Elements like
figuredo not react to grids since they are supposed to have no semantical bearing on the document structure.